
When the non-accommodating eye’s optical system is unable to focus parallel light beams on the retinal plane because of an imbalance in the eye’s axial length and refractive power, this is known as refractive error (RE) [1]. Refractive correction is necessary to see clearly because the person’s perception of the resulting image is blurry. Myopia (short or nearsightedness), hyperopia (long or farsightedness), and astigmatism (irregularly curved cornea) are the three categories of RE [2].
One of the most frequent causes of blindness and visual impairment has been identified as RE [3]. At least 2.2 billion people worldwide are thought to be visually impaired, and 19 million children under the age of 15 are affected globally, with 43% of these cases being caused by RE [4].
Research has shown that young children are becoming visually impaired as a result of spending more time playing video games and watching television [5]. Many ocular symptoms, such as eyestrain, fatigue, irritability, redness, blurred vision, and double vision, are experienced by those kids. Children with visual impairment brought on by uncorrected REs may experience severe consequences, such as limited employment opportunities and poor academic performance. Furthermore, this could result in slower economic growth and a decline in the standard of living for individuals, families, and communities [6]. The present study aimed to determine the prevalence and types of RE among school children.
From February 2023 to February 2025, a cross-sectional study was conducted in an Imam Husain Eye Medical Center. 3227 adolescent eyes in all were examined for REs. Before the adolescent were enrolled in the study, the parents and the adolescents gave their consent.
The team that performed the clinical examination typically consisted of two ophthalmologist and four optometrists.
A retroilluminated logMAR chart with five tumbling E-Optotypes on each line was used to measure the trained personnel’s uniocular visual acuity at a distance of 4 meters (Precision Vision, La Sale, Illinois, USA). Adolescents were instructed to point with their hands or speak the direction for the examiner to hear in order to indicate the E optotype’s direction. Adolescents who wear glasses had their visual acuity tested both with and without them.
Two drops of 1% cyclopentolate were given by the nurse five minutes apart, followed by a third drop fifteen minutes later, to induce cycloplegia in children whose unaided (uncorrected) visual acuity was 20/40 (6/12) or worse in either eye. After another 20 to 30 minutes, a final evaluation determined that complete cycloplegia was present when there was a dilation of the pupil of 6 mm or more.
A measured objective refraction of \(\leq\)-0.25D spherical equivalent in one or both eyes was considered myopia. When one or both eyes had a measured objective refraction of \(\geq\)+0.25D spherical equivalent, hyperopia was taken into consideration. When one or both eyes had a measured objective refraction of \(\geq\)+0.25 D cylinder or\(\leq\)-0.25D, astigmatism was taken into consideration. The spherical value plus half of the astigmatism value was used to compute the spherical equivalent (SE).
IBM SPSS version 25 was used for all statistical analyses (SPSS Inc., Chicago, Illinois, USA). Qualitative data summarized as numbers and percentage. The chi-square test, a non-parametric test of significance, was used to compare the groups. The student t-test is used to analyze quantitative data, which is displayed as the mean and standard deviation. Statistical significance was established at 0.05 and the p-value was two-tailed.
The mean age of the participants was 15.75±1.77 years. Categorization of age revealed that the age group 17-18 years was the most common accounting for 40.53% followed by age group 15-16 years (30.46%) and finally age group 13-14 years (29%). Girls were predominated and accounted for 61.67% of the participant while boys represented 38.27% (Table 1).
| Variables | Category | Value |
|---|---|---|
| Age, years | Mean±SD | 15.75±1.77 |
| Range | 13-18 | |
| 13-14 | 936(29.0%) | |
| 15-16 | 983(30.46%) | |
| 17-18 | 1308(40.53%) | |
| Sex | Boys | 1235(38.27%) |
| Girls | 1990(61.67%) |
Table 2 presents the prevalence and characteristics of refractive. Visual acuity varied, with the highest proportions observed at 6/9 (21.13%) and 6/6 (19.18%), while more severe impairments such as 6/60 and \(<\)6/60 were less common (8.86% and 0.53%, respectively) although \(<\)6/60 accounted for 10.41% of the included participants. Astigmatism was present in 65.14% of participants, predominantly with a with-the-rule orientation (65.56%), followed by oblique (20.6%) and against-the-rule (13.84%). Hypermetropia was identified in 14.6% of individuals, mostly of low severity (77.92%). Myopia was nearly equally split, with 50.45% of individuals affected, primarily with mild severity (85.26%). The mean spherical equivalent was -0.97 ± 2.8 diopters with a wide range extending up to -12.0.
| Refractive error | Category | Value |
|---|---|---|
| Visual acuity | 6-Jun | 619(19.18%) |
| 9-Jun | 682(21.13%) | |
| 12-Jun | 381(11.81%) | |
| 18-Jun | 339(10.51%) | |
| 24-Jun | 567(17.57%) | |
| Jun-36 | 286(8.86%) | |
| Jun-60 | 17(0.53%) | |
| <6/60 | 336(10.41%) | |
| Astigmatism | Absent | 1125(34.86%) |
| Present | 2102(65.14%) | |
| Orientation of astigmatism | With the rule | 1378(65.56%) |
| Against the rule | 291(13.84%) | |
| Oblique | 433(20.6%) | |
| Hypermetropia | Absent | 2756(85.4%) |
| Present | 471(14.6%) | |
| Hypermetropia severity | Low | 367(77.92%) |
| Intermediate | 85(18.05%) | |
| High | 19(4.03%) | |
| Myopia | Absent | 1599(49.55%) |
| Present | 1628(50.45%) | |
| Myopia severity | Mild | 1388(85.26%) |
| Moderate | 163(10%) | |
| High | 77(4.73%) | |
| Spherical equivalent | Mean±SD | -0.97±2.8 |
| Range | -0.87.5 -12.0 |
Table 3 illustrates the association of demographic characteristics with refractive errors. The distribution of visual acuity did not differ significantly across different age groups (p-value = 543). However, there was a marked variation in VA between boys and girls. In particular, 6/6 and 6/9 VA were more common among girls (20% and 22.96%, respectively) than boys (17.89% and 20.65%, respectively). In contrast, 13.04% of boys had 6/12 VA compared with 11.06% of girls. Statically, there was a highly significant difference (p= 0.001).
Similarly, there was no significant differences in prevalence of astigmatism between different age groups (p= 0.189), while astigmatism was more common among boys than girls (67.13% vs. 63.1%) with a significant difference (p= 0.002).
The majority of participants had astigmatism ’with rule’ across all age and sex categories. However, there is a significant difference in the distribution of astigmatism orientation across age groups (p-value \(<\) 0.001), with the largest proportion of ’with rule’ astigmatism seen in the 13-14 years group (69.6%). The orientation of astigmatism does not show a significant difference between boys and girls (p-value = 0.676).
A significant difference was found across age groups and sexes in hypermetropia. For instance, the prevalence of hypermetropia is higher in the 14-15 years age group (21.15%), and it decreases in older age groups. The prevalence of hypermetropia is significantly different across age groups (p-value \(<\) 0.001) and between boys and girls (p-value \(<\) 0.001), with more boys exhibiting hypermetropia than girls (18.38% vs. 12.26%).
The severity of hypermetropia did not show a significant difference between age groups. On the other hand, intermediate and high hypermetropia accounted for 22.03% and 6.17%, respectively of boys with hypermetropia compared with 14.34% and 2.05%, respectively of girls with hypermetropia, with a significant difference (p= 0.004).
| Variables | Age categories | Sex | |||
|---|---|---|---|---|---|
| 13-14 yrs | 15-16 yrs | 17-18 yrs | Boys | Girls | |
| (n= 936) | (n= 983) | (n= 1308) | (n= 1235) | (n= 1990) | |
| Visual acuity | |||||
| 6/6 | 184(19.66%) | 178(18.11%) | 257(19.56%) | 221(17.89%) | 398(20%) |
| 9-Jun | 217(23.18%) | 197(20.04%) | 268(20.49%) | 255(20.65%) | 457(22.96%) |
| 12-Jun | 115(12.29%) | 117(11.9%) | 149(11.39%) | 161(13.04%) | 220(11.06%) |
| 18-Jun | 84(8.97%) | 116(11.8%) | 139(10.63%) | 131(10.61%) | 208(10.45%) |
| 24-Jun | 167(17.84%) | 181(18.41%) | 219(16.74%) | 216(17.49%) | 349(17.54%) |
| Jun-36 | 80(8.55%) | 82(8.34%) | 124(9.48%) | 114(9.23%) | 172(8.64%) |
| Jun-60 | 4(0.43%) | 7(0.71%) | 6(0.46%) | 9(0.73%) | 9(0.45%) |
| <6/60 | 85(9.08%) | 105(10.68%) | 146(11.16%) | 159(12.87%) | 177(8.89%) |
| p-value | 0.543 | 0.001 | |||
| Astigmatism | |||||
| Absent | 309(33%) | 337(34.28%) | 479(36.62%) | 390(31.58%) | 735(36.9%) |
| Present | 627(67%) | 646(65.72%) | 829(63.38%) | 829(67.13%) | 1255(63.1%) |
| p-value | 0.189 | 0.002 | |||
| Orientation | |||||
| With rule | 433(69.06%) | 382(38.86%) | 563(67.91%) | 549(66.22%) | 827(65.9%) |
| Against rule | 85(13.56%) | 68(6.92%) | 138(16.65%) | 114(13.75%) | 177(14.1%) |
| Oblique | 109(17.38%) | 196(19.94%) | 128(15.44%) | 182(21.95%) | 251(20%) |
| p-value | <0.001 | 0.676 | |||
| Hypermetropia | |||||
| Absent | 738(78.85%) | 849(86.37%) | 1169(89.37%) | 1008(81.62%) | 1746(87.74%) |
| Present | 198(21.15%) | 134(13.63%) | 139(10.63%) | 227(18.38%) | 244(12.26%) |
| p-value | <0.001 | <0.001 | |||
| Severity | |||||
| Low | 147(74.24%) | 112(83.58%) | 108(77.7%) | 163(71.81%) | 204(83.61%) |
| Intermediate | 43(21.72%) | 17(12.69%) | 25(18%). | 50(22.03%) | 35(14.34%) |
| High | 8(4.04%) | 5(3.73%) | 6(4.3%) | 14(6.17%) | 5(2.05%) |
| p-value | 0.335 | 0.004 | |||
| Myopia | |||||
| Absent | 526(56.2%) | 483(49.14%) | 590(45.11%) | 648(52.47%) | 951(47.79%) |
| Present | 410(43.8%) | 500(50.86%) | 718(54.89%) | 587(47.53%) | 1039(52.21%) |
| p-value | <0.001 | 0.01 | |||
| Severity | |||||
| Mild | 348(84.88%) | 418(83.6%) | 622(86.63%) | 487(82.96%) | 899(86.53%) |
| Moderate | 39(9.51%) | 52(10.4%) | 72(10.03%) | 59(10.05%) | 104(10%) |
| High | 23(5.61%) | 30(6%) | 24(3.34%) | 41(6.98%) | 36(3.46%) |
| p-value | 0.214 | 0.006 | |||
| SE, D | -0.79±3.71 | -1.06±2.55 | -1.02±2.14 | -0.89±2.62 | -1.01±2.9 |
| p-value | 0.079 | 0.248 | |||
A significant difference in myopia prevalence was observed across age groups (p-value \(<\) 0.001), with older age groups showing a higher proportion of myopia (54.89%). Additionally, the prevalence of myopia between boys and girls shows a significant difference (p-value = 0.010), with a slightly higher prevalence in girls (52.21%) than boys (47.53%).
The severity of myopia shows no significant difference across age groups (p-value = 0.214). However, 6.98% of boys with myopia had a severe condition compared with 3.46% of girls with a significant difference (p= 0.006).
The mean SE for each age group or sexes was close to -1.0 diopters, with slight variations between groups. However, these differences are not statistically significant (p-value = 0.248 for sex, and p-value = 0.079 for age).
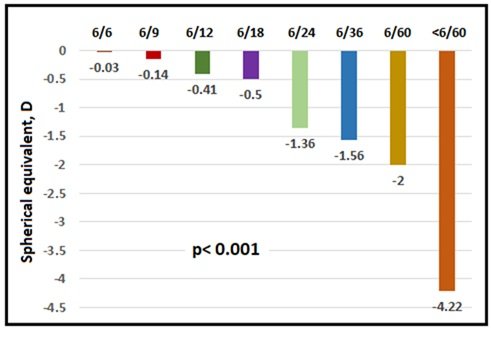
Generally, the mean SE increase with the severity of eye impairment starting with -0.03 for 6/6 VA and ending with -4.22 for \(<\)6/60 VA with significant differences between each two categories of VA (Figure 1).
Refractive errors are a significant public health concern among adolescents worldwide. Many affected individuals remain unaware of their visual impairment, assuming their vision is normal. This study, to our knowledge one of the largest of its kind conducted in Iraq, provides valuable insights into the prevalence and associated factors of REs in adolescents, revealing a concerningly high burden.
The study population predominantly comprised adolescents aged 13–18 years, with the 17–18 age group being most represented. Girls made up the majority of participants (61.67%), with boys accounting for 38.27%. These findings are comparable with studies from South Africa and Nigeria. In the South African cohort, 19.3% of males and 14.9% of females had REs [7], while the Nigerian study found a slight female predominance [8].
In terms of visual acuity, 40.32% of participants had normal or near-normal vision (6/6 or 6/9), while 22.31% presented with mildly impaired VA (6/12 to 6/18), 26.43% with moderate impairment (6/24 to 6/36), and 10.94% with severe impairment (6/60 or worse). This distribution contrasts markedly with the Nigerian data, where 94.6% had normal or near-normal vision, and severe impairment was seen in just 0.08% [8].
Our findings indicate that astigmatism was the most prevalent type of RE (65.14%), followed by myopia (50.45%) and hypermetropia (14.6%). These results are comparable to data from China, where the prevalence of astigmatism was 59.3% [9], and from Egypt, where myopia and astigmatism were reported in 55.3% and 51% of children, respectively [10]. Interestingly, in Oman, astigmatism was much lower (2%) compared to myopia (94%) [11]. In contrast, Mahjoob et al. reported a hypermetropia-dominant pattern in Iran, with 58.1% hypermetropia, 6.3% myopia, and 3.4% astigmatism [12]. Globally, myopia remains the most common RE among school-aged children [13,14,15,16], with its prevalence in the Middle East higher than in Africa [17] but lower than global figures, including those from India and China [18,19].
These regional differences in prevalence may reflect the influence of geographic, socioeconomic, and ethnic factors, along with genetic predisposition and lifestyle habits such as limited outdoor activity and increased screen exposure. Variability in study methodologies, sample sizes, and diagnostic criteria also contributes to the wide range of reported values.
A significant gender disparity in visual acuity was observed. A greater proportion of girls exhibited normal or near-normal VA (6/6 and 6/9) compared to boys (20% vs. 17.89% for 6/6; 22.96% vs. 20.65% for 6/9), while more boys had mild visual impairment (13.04% vs. 11.06%). This gender-based difference was statistically significant (p = 0.001). Dandona et al. [20] similarly reported lower visual impairment among girls, potentially due to higher health awareness and earlier care-seeking behavior. Maul et al. [21] found higher myopia rates in boys, and Logan et al. [22] suggested that boys’ increased screen time and reduced outdoor exposure may contribute to greater refractive error development.
Sociocultural and behavioral aspects may also explain these differences. Girls may be more likely to attend screenings and adhere to spectacle use, while boys might underreport symptoms or show lower compliance, contributing to a higher rate of uncorrected REs.
Astigmatism was significantly more prevalent in boys (67.13%) than in girls (63.1%) (p = 0.002). This aligns with findings by Fan et al. [23], who reported higher astigmatism rates in boys, possibly due to anatomical variations such as eyelid tension that can affect corneal curvature. Environmental exposures, visual behaviors, and differences in visual hygiene may also contribute.
The orientation of astigmatism was also age-dependent, with the 13–14 age group showing the highest proportion of with-the-rule (WTR) astigmatism. This finding is consistent with previous studies that reported a WTR-to-against-the-rule (ATR) shift with age [24]. The mechanism may involve age-related changes in eyelid pressure or medial rectus muscle action during convergence, which can alter corneal curvature [25,26].
In our study, older students had a higher prevalence of myopia, with a slightly greater occurrence among girls, although boys tended to have more severe cases. A South African study also found a higher prevalence of myopia among males aged 6–18 years, with low myopia being most frequent [7]. Conversely, a Polish study noted that myopia was more frequent in girls, while hyperopia was more prevalent among boys [27].
The persistence of myopia through adolescence into early adulthood, as seen in this study, is consistent with the known trajectory of myopic progression, which typically stabilizes around the late teens when ocular and general body growth plateaus.
Hypermetropia, on the other hand, was more prevalent in the 14–15 age group and showed a higher incidence in boys. While this contradicts some previous research [28], the observed trend of decreasing hypermetropia with age aligns with several studies [29,30]. These trends may be attributed to structural changes in the eye such as reduced lens curvature or axial length, and the unmasking of latent hyperopia with declining accommodative ability associated with aging [31].
One of the most critical findings was the clear inverse relationship between spherical equivalent (SE) and visual acuity. Individuals with 6/6 VA had a near-emmetropic SE of –0.03 D, whereas those with \(<\)6/60 VA had a significantly more myopic mean SE of –4.22 D. This progression was statistically significant and supports the established association between worsening myopia and reduced uncorrected VA.
This correlation echoes findings by Saw et al. [32], who demonstrated that negative SE values increased with declining VA among Singaporean schoolchildren. Similarly, Fotouhi et al. [33] confirmed the relationship between higher degrees of myopia and reduced vision in Iranian students. The more negative SE among those with poorer VA in our study suggests a high prevalence of uncorrected moderate-to-severe myopia, which may hinder academic performance and quality of life if not addressed.
Collectively, these data revealed a high prevalence of refractive errors among school children, with astigmatism being the most common, followed by myopia and hypermetropia. These conditions showed significant associations with age and gender—myopia increased with age and was more common in girls, while hypermetropia was more prevalent in younger children and boys. Visual acuity was generally better among girls, and the severity of refractive errors correlated with lower spherical equivalent values. Based on these findings, it is recommended to implement regular adolescent vision screenings, provide affordable corrective measures, promote eye health education, and develop gender-sensitive interventions. Additionally, monitoring refractive error progression, especially in older adolescent, and integrating vision care into health policies are essential for early detection and effective management.