
The World Health Organization defines adolescence as the second decade of life. It is a time of significant physical, psychological, and social development, as well as a period of psychological and physiological vulnerability [1]. The transition from childhood to adolescence is marked by substantial physical, emotional, cognitive, and social transformations, characterized by dynamic development where interactions with the environment influence individual resources essential for well-being and health. According to Mastorci et al. [2], it is a critical time when adolescents make decisions about their lives and acquire behaviors that will follow them into adulthood. Consequently, it is considered the ideal moment to influence the formation of attitudes and behaviors [3, 4].
This phase of growth, sexual maturation, and cerebral development is characterized by heightened nutritional demands for teenagers to reach their full growth potential [5]. Nutritional status during adolescence is a crucial element in the human life cycle [6]. Biological, psychological, and cognitive transformations during adolescence strongly influence nutritional status and dietary requirements [7].
During adolescence, children gain fifty percent of their adult weight, forty percent of their peak bone mass, and fifteen to twenty percent of their height. The dietary status of teenagers significantly influences long-term cardiovascular fitness, the risk of non-communicable diseases, and immunity, thereby affecting the overall health indices of a community over time [8].
Proper nutrient consumption is essential throughout all life stages, especially during adolescence, to support rapid physiological growth and development while establishing a foundation for long-term health. Steady increases in life expectancy indicate that today’s youth are expected to lead long and productive lives [9].
Adolescents and children with healthy eating habits are more likely to grow up healthy and intellectually developed. They are also less likely to encounter critical health problems such as learning and work impairment [10].
Poor eating habits are common during adolescence and include eating fewer fruits and vegetables per meal, drinking more sugary drinks, consuming more energy-dense foods, eating out more frequently with friends, skipping meals (especially breakfast), and relying on high-calorie, high-fat, high-sugar fast food [11].
Nutritional status is widely recognized as a key indicator of individual health. The World Health Organization classifies adolescents’ nutritional status using body mass index-for-age Z scores (BAZ scores). The classification is based on standard deviations from the mean of a reference population. A BAZ score of less than -2 standard deviations indicates thinness or underweight. BAZ scores of -2 to +1 standard deviations are considered normal or healthy weight. BAZ scores of +1 to +2 standard deviations indicate overweight. BAZ scores equal to or over +2 standard deviations indicate obesity [12].
Body Mass Index (BMI) is a classification of body composition that reflects an individual’s health status. The BMI scale is divided into four groups based on Asian classification: underweight (\(<\)18.5 kg/m2), normal weight (18.5–22.9 kg/m2), overweight (23–24.9 kg/m2), and obesity 1 (25–29.9 kg/m2) [13].
A person’s BMI is important in evaluating the possibility of future health concerns, and maintaining a normal range is an acceptable objective for a healthy life [14].
Immediate and long-term health consequences are linked to unhealthy diets consumed during childhood and adolescence. Reduced growth rates, delayed sexual maturity, diminished micronutrient stores, and insufficient bone mass are short-term effects of inadequate dietary intake of specific micronutrients, proteins, or calories. In addition to increasing the likelihood of developing conditions such as dental caries and iron deficiency, adolescent dietary habits can reduce immunity to infectious diseases and negatively impact cognitive and physical abilities [15].
Establishing healthy eating routines is critical during childhood and adolescence, as these practices may have cumulative effects on health and are likely to be sustained into adulthood [16].
The objectives of the study are threefold. First, to assess the dietary intake of adolescents. Second, to examine the relationship between dietary intake and body mass index (BMI). Third, to explore the association between dietary intake and various demographic characteristics.
A quantitative, cross-sectional descriptive design is used to find out the association of dietary intake with BMI among adolescents in secondary schools at Hilla city center from February 27 to April 7, 2025. The study sample was chosen purposively (non-probability) and consisted of 368 students from secondary schools.
The questionnaire used for data collection was adapted to meet the objectives of the current study. It is divided into three sections that address all key aspects of the research. The first section collects demographic information from adolescents and their parents. The second section includes anthropometric measurements such as height and weight in relation to age. The third section focuses on dietary intake information.
In Table 1, the results of this study indicate that most adolescents are aged 15–16 years (56.0%), while 44.0% are aged 17–18 years. The mean age is 16.4 ± 0.87 years (range: 15–18 years). The gender ratio is 60.1% girls to 39.9% boys. Half of the adolescents are in the fourth class and the other half in the fifth class. The highest proportion of fathers had an institute, college degree, or higher education (35.3%), followed by primary school graduates (18.2%), secondary school graduates (17.1%), middle school graduates (16.8%), those who can read and write (8.2%), and illiterate individuals (4.3%).
Furthermore, the highest proportion of mothers also had an institute, college degree, or higher (33.4%), followed by primary school graduates (23.9%), middle school graduates (16.3%), secondary school graduates (14.4%), those who can read and write (7.3%), and illiterate individuals (4.6%). Regarding occupational status, the majority of fathers (50.3%) were employed, while most mothers (67.7%) were housewives. The results show that 64.7% of the participants reported having a sufficient level of income, followed by 24.7% with barely sufficient income, and 10.6% with insufficient income. Finally, most participants live in urban areas (83.7%) compared to those in rural areas (16.3%).
In Table 2, the results show that most adolescents were of normal weight (52.7%), followed by those who were overweight (20.9%) and underweight (17.9%). The lowest percentage (8.4%) were classified as obese. The mean BMI was 23.06 ± 4.81 (range: 15.26–45.09). The mean weight was 61.61 ± 13.61 kg (range: 36.0–116.0 kg), while the mean height was 163.33 ± 9.08 cm (range: 140.0–191.0 cm).
In Table 3, the results show that the highest percentage (37.2%) of adolescents consumed bread two or more times daily. About 26.1% consumed rice once daily, and 34.2% consumed pasta once weekly. The highest proportions of adolescents consumed fish (53.0%), chicken (26.6%), and lamb meat (30.4%) once weekly. Most adolescents ate fruits and vegetables once weekly.
Regarding fast foods, 40.2% ate pizza, 35.6% ate burgers, 32.9% ate falafel, and 40.8% ate shawarma once weekly. Regarding other items, the study found that the largest proportion of adolescents consumed most dairy products, sweets and snacks, and beverages once weekly.
| Socio-demographic characteristics | No. | % | |
|---|---|---|---|
| Age | 15-16 years | 206 | 56.0 |
| 17-18 years | 162 | 44.0 | |
| Mean± SD (Range) | 16.4±0.87 (15-18) | ||
| Sex | Male | 147 | 39.9 |
| Female | 221 | 60.1 | |
| Class | 4 | 184 | 50.0 |
| 5 | 184 | 50.0 | |
| Education of father | Illiterate | 16 | 4.3 |
| Can read and write | 30 | 8.2 | |
| Primary school graduate | 67 | 18.2 | |
| Middle school graduate | 62 | 16.8 | |
| Secondary school graduate | 63 | 17.1 | |
| Institute ,College graduate or above | 130 | 35.3 | |
| Education of Mother | Illiterate | 17 | 4.6 |
| Can read and write | 27 | 7.3 | |
| Primary school graduate | 88 | 23.9 | |
| Middle school graduate | 60 | 16.3 | |
| Secondary school graduate | 53 | 14.4 | |
| Institute , College graduate or above | 123 | 33.4 | |
| Occupation of Father | Employee | 185 | 50.3 |
| Self-employed | 143 | 38.9 | |
| Retired | 33 | 9.0 | |
| Out of work | 7 | 1.9 | |
| Occupation of Mother | Employee | 119 | 32.3 |
| Housewife | 249 | 67.7 | |
| Retired | 0 | .0 | |
| Family income | Sufficient | 238 | 64.7 |
| Barely Sufficient | 91 | 24.7 | |
| Insufficient | 39 | 10.6 | |
| Residence | Urban | 308 | 83.7 |
| Rural | 60 | 16.3 | |
| Socio-demographic characteristics | No. | % | |
|---|---|---|---|
| BMI categories | Underweight | 66 | 17.9 |
| Normal weight | 194 | 52.7 | |
| Overweight | 77 | 20.9 | |
| Obesity | 31 | 8.4 | |
| Mean± SD | Min-Max | ||
| BMI (Kg/H2 ) | 23.06±4.81 | 15.26-45.09 | |
| Height (cm) | 163.33±9.08 | 140.00-191.00 | |
| Weight (Kg) | 61.61±13.61 | 36.00-116.00 | |
| Food Items | Never |
Once per
week |
Twice per
week |
3-4 times
per week |
5-6 times
per week |
Once daily |
2 or more
times per day |
|||||||
| No. | % | No. | % | No. | % | No. | % | No. | % | No. | % | No. | % | |
| Grains | ||||||||||||||
| Bread | 7 | 1.9 | 13 | 3.5 | 30 | 8.2 | 43 | 11.7 | 77 | 20.9 | 61 | 16.6 | 137 | 37.2 |
| Rice | 6 | 1.6 | 13 | 3.5 | 33 | 9.0 | 52 | 14.1 | 89 | 24.2 | 96 | 26.1 | 79 | 21.5 |
| Pasta | 79 | 21.5 | 126 | 34.2 | 84 | 22.8 | 28 | 7.6 | 14 | 3.8 | 21 | 5.7 | 16 | 4.3 |
| Fish, poultry and meat | ||||||||||||||
| Fish | 72 | 19.6 | 195 | 53.0 | 48 | 13.0 | 20 | 5.4 | 5 | 1.4 | 18 | 4.9 | 10 | 2.7 |
| Chicken | 92 | 25.0 | 98 | 26.6 | 90 | 24.5 | 41 | 11.1 | 19 | 5.2 | 16 | 4.3 | 12 | 3.3 |
| Lamb meat | 93 | 25.3 | 112 | 30.4 | 63 | 17.1 | 45 | 12.2 | 26 | 7.1 | 16 | 4.3 | 13 | 3.5 |
| Beef | 10 | 2.7 | 66 | 17.9 | 83 | 22.6 | 91 | 24.7 | 60 | 16.3 | 37 | 10.1 | 21 | 5.7 |
| Eggs | 57 | 15.5 | 46 | 12.5 | 55 | 14.9 | 48 | 13.0 | 66 | 17.9 | 74 | 20.1 | 22 | 6.0 |
| Fruit Vegetables. | ||||||||||||||
| Dates | 41 | 11.1 | 59 | 16.0 | 45 | 12.2 | 38 | 10.3 | 60 | 16.3 | 60 | 16.3 | 65 | 17.7 |
| Orange | 37 | 10.1 | 70 | 19.0 | 66 | 17.9 | 61 | 16.6 | 48 | 13.0 | 31 | 8.4 | 55 | 14.9 |
| Banana | 53 | 14.4 | 93 | 25.3 | 81 | 22.0 | 45 | 12.2 | 28 | 7.6 | 21 | 5.7 | 47 | 12.8 |
| Apple | 54 | 14.7 | 114 | 31.0 | 70 | 19.0 | 36 | 9.8 | 31 | 8.4 | 19 | 5.2 | 44 | 12.0 |
| Pomegranate | 75 | 20.4 | 109 | 29.6 | 60 | 16.3 | 37 | 10.1 | 36 | 9.8 | 14 | 3.8 | 37 | 10.1 |
| Lemon | 72 | 19.6 | 126 | 34.2 | 56 | 15.2 | 39 | 10.6 | 19 | 5.2 | 23 | 6.3 | 33 | 9.0 |
| Tomatoes | 69 | 18.8 | 71 | 19.3 | 46 | 12.5 | 55 | 14.9 | 44 | 12.0 | 40 | 10.9 | 43 | 11.7 |
| Potatoes | 32 | 8.7 | 62 | 16.8 | 55 | 14.9 | 66 | 17.9 | 53 | 14.4 | 39 | 10.6 | 61 | 16.6 |
| Eggplant | 122 | 33.2 | 93 | 25.3 | 46 | 12.5 | 33 | 9.0 | 38 | 10.3 | 18 | 4.9 | 18 | 4.9 |
| Cucumber | 32 | 8.7 | 81 | 22.0 | 51 | 13.9 | 62 | 16.8 | 54 | 14.7 | 31 | 8.4 | 57 | 15.5 |
| Pepper | 106 | 28.8 | 99 | 26.9 | 51 | 13.9 | 29 | 7.9 | 36 | 9.8 | 21 | 5.7 | 26 | 7.1 |
| Onion | 136 | 37.0 | 94 | 25.5 | 25 | 6.8 | 38 | 10.3 | 29 | 7.9 | 14 | 3.8 | 32 | 8.7 |
| Fast food | ||||||||||||||
| Pizza | 70 | 19.0 | 148 | 40.2 | 64 | 17.4 | 43 | 11.7 | 19 | 5.2 | 11 | 3.0 | 13 | 3.5 |
| Burger | 76 | 20.7 | 131 | 35.6 | 64 | 17.4 | 43 | 11.7 | 22 | 6.0 | 14 | 3.8 | 18 | 4.9 |
| Falafel | 72 | 19.6 | 121 | 32.9 | 78 | 21.2 | 38 | 10.3 | 27 | 7.3 | 13 | 3.5 | 19 | 5.2 |
| Shawarma | 66 | 17.9 | 150 | 40.8 | 45 | 12.2 | 49 | 13.3 | 25 | 6.8 | 13 | 3.5 | 20 | 5.4 |
| Dairy product | ||||||||||||||
| Milk | 125 | 34.0 | 83 | 22.6 | 58 | 15.8 | 26 | 7.1 | 28 | 7.6 | 24 | 6.5 | 24 | 6.5 |
| Yogurt | 69 | 18.8 | 77 | 20.9 | 65 | 17.7 | 50 | 13.6 | 29 | 7.9 | 41 | 11.1 | 37 | 10.1 |
| Cheese | 59 | 16.0 | 76 | 20.7 | 64 | 17.4 | 40 | 10.9 | 47 | 12.8 | 49 | 13.3 | 33 | 9.0 |
| Sweets Snacks | ||||||||||||||
| Cake | 52 | 14.1 | 122 | 33.2 | 59 | 16.0 | 34 | 9.2 | 36 | 9.8 | 29 | 7.9 | 36 | 9.8 |
| Potato chips | 43 | 11.7 | 57 | 15.5 | 46 | 12.5 | 49 | 13.3 | 55 | 14.9 | 42 | 11.4 | 76 | 20.7 |
| Corn chips | 80 | 21.7 | 83 | 22.6 | 45 | 12.2 | 41 | 11.1 | 54 | 14.7 | 27 | 7.3 | 38 | 10.3 |
| Popcorn | 110 | 29.9 | 82 | 22.3 | 56 | 15.2 | 39 | 10.6 | 31 | 8.4 | 13 | 3.5 | 37 | 10.1 |
| Biscuits | 65 | 17.7 | 63 | 17.1 | 58 | 15.8 | 49 | 13.3 | 56 | 15.2 | 34 | 9.2 | 43 | 11.7 |
| Nuts | 44 | 12.0 | 77 | 20.9 | 59 | 16.0 | 48 | 13.0 | 61 | 16.6 | 35 | 9.5 | 44 | 12.0 |
| Beverage | ||||||||||||||
| Tea | 76 | 20.7 | 55 | 14.9 | 36 | 9.8 | 32 | 8.7 | 38 | 10.3 | 32 | 8.7 | 99 | 26.9 |
| Coffee | 117 | 31.8 | 93 | 25.3 | 50 | 13.6 | 22 | 6.0 | 29 | 7.9 | 19 | 5.2 | 38 | 10.3 |
| Juice | 20 | 5.4 | 69 | 18.8 | 63 | 17.1 | 66 | 17.9 | 47 | 12.8 | 37 | 10.1 | 66 | 17.9 |
| Pepsi, coke, 7-up | 55 | 14.9 | 67 | 18.2 | 46 | 12.5 | 47 | 12.8 | 48 | 13.0 | 26 | 7.1 | 79 | 21.5 |
| Soda | 197 | 53.5 | 76 | 20.7 | 31 | 8.4 | 18 | 4.9 | 10 | 2.7 | 10 | 2.7 | 26 | 7.1 |
| Diet Intake | P- value | |||||
| Poor diet intake | Good diet intake | |||||
| No. | % | No. | % | |||
| Age | 15-16 years | 119 | 57.8 | 87 | 42.2 | 0.508 |
| 17-18 years | 88 | 54.3 | 74 | 45.7 | ||
| Sex | Male | 73 | 49.7 | 74 | 50.3 | 0.038 |
| Female | 134 | 60.6 | 87 | 39.4 | ||
| Class | 4 | 101 | 54.9 | 83 | 45.1 | 0.599 |
| 5 | 106 | 57.6 | 78 | 42.4 | ||
| Education of father | Illiterate | 10 | 62.5 | 6 | 37.5 | 0.809 |
| Can read and write | 17 | 56.7 | 13 | 43.3 | ||
| Primary school graduate | 38 | 56.7 | 29 | 43.3 | ||
| Middle school graduate | 39 | 62.9 | 23 | 37.1 | ||
| Secondary school graduate | 32 | 50.8 | 31 | 49.2 | ||
| Institute , College graduate or above | 71 | 54.6 | 59 | 45.4 | ||
| Education of Mother | Illiterate | 13 | 76.5 | 4 | 23.5 | 0.008 |
| Can read and write | 16 | 59.3 | 11 | 40.7 | ||
| Primary school graduate | 59 | 67.0 | 29 | 33.0 | ||
| Middle school graduate | 37 | 61.7 | 23 | 38.3 | ||
| Secondary school graduate | 28 | 52.8 | 25 | 47.2 | ||
| Institute ,College graduate or above | 54 | 43.9 | 69 | 56.1 | ||
| Occupation of Father | Employee | 97 | 52.4 | 88 | 47.6 | 0.102 |
| Self-employed | 81 | 56.6 | 62 | 43.4 | ||
| Retired | 25 | 75.8 | 8 | 24.2 | ||
| Out of work | 4 | 57.1 | 3 | 42.9 | ||
| Occupation of Mother | Employee | 56 | 47.1 | 63 | 52.9 | 0.014 |
| Housewife | 151 | 60.6 | 98 | 39.4 | ||
| Family income | Sufficient | 117 | 49.2 | 121 | 50.8 | 0.001 |
| Barely Sufficient | 65 | 71.4 | 26 | 28.6 | ||
| Insufficient | 25 | 64.1 | 14 | 35.9 | ||
| Residence | Urban | 173 | 56.2 | 135 | 43.8 | 0.943 |
| Rural | 34 | 56.7 | 26 | 43.3 | ||
| Diet intake | P- value | |||||
| Poor diet intake | Good diet intake | |||||
| No. | % | No. | % | |||
| BMI categories | Underweight | 45 | 68.2 | 21 | 31.8 | 0.034 |
| Normal weight | 96 | 49.5 | 98 | 50.5 | ||
| Overweight | 46 | 59.7 | 31 | 40.3 | ||
| Obesity | 20 | 64.5 | 11 | 35.5 | ||
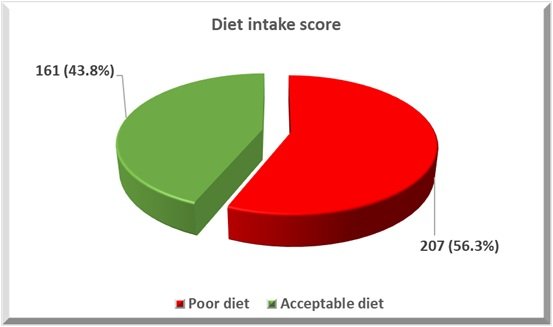
In Figure 1, the results of this study indicate that 56.4% of adolescents follow a poor diet intake, while 43.8% of adolescents follow a good diet intake.
In Table 4, the results of this study reveal that there is a statistically significant relationship between demographic characteristics (such as sex, education and occupation of the mother, and family income) and the total score of diet intake (P-value \(<\) 0.05). These results suggest that male sex, higher maternal education, employed mothers, and higher family income are associated with better diet intake.
In Table 5, the results of this study reveal that there is a significant relationship between body mass index and the total score of diet quality (P-value = 0.037). These results suggest that normal weight is associated with better diet intake.
In Table 6, the results show that females are more likely to be associated with poor diet quality (OR = 2.072; C.I. 1.311–3.277; P-value = 0.002). Additionally, maternal illiteracy and elementary education levels increase the risk of poor food consumption among adolescents by an odds ratio of 3.9 and 2.799 times, respectively, compared to higher education levels. Furthermore, insufficient family income is associated with poor diet intake (OR = 2.377; C.I. 1.362–4.150; P-value = 0.002).
| Multivariate logistic Regression | B | P- value | Odd Ratio (OR) | 95% C.I. for OR | ||
| Lower | Upper | |||||
| Gender | Female | 0.729 | 0.002 | 2.072 | 1.311 | 3.277 |
| Male | Reference | |||||
|
Educational level of
mother |
Illiterate | 1.361 | 0.039 | 3.900 | 1.069 | 14.234 |
| Can read and write | 0.566 | 0.268 | 1.762 | 0.646 | 4.804 | |
| Primary school graduate | 1.029 | 0.006 | 2.799 | 1.336 | 5.863 | |
| Middle school graduate | 0.741 | 0.068 | 2.097 | 0.946 | 4.652 | |
| Secondary school graduate | 0.444 | 0.229 | 1.558 | 0.756 | 3.211 | |
|
Institute ,College
graduate or above |
Reference | |||||
| Occupation of mother | Employed | Reference | ||||
| Housewife | -0.087 | 0.786 | 0.917 | 0.490 | 1.715 | |
| Family income | Insufficient | 0.866 | 0.002 | 2.377 | 1.362 | 4.150 |
| Barely Sufficient | 0.398 | 0.300 | 1.489 | 0.701 | 3.164 | |
| Sufficient | Reference | |||||
| Constant | -0.890 | 0.001 | .411 | |||
In Table 1, an overview of the socio-demographic characteristics of adolescents who were examined for dietary intake and BMI is presented.
The total sample in this study was 368. Table 1 shows that the majority of the sample were female (60.1%). These results agree with a study conducted in [17] on 115 adolescents, which found that about 50.4% of participants were female. Another study also supports the present results; a study by [18] found that 57% of adolescent participants were female.
The researcher’s opinion is that this may be due to females’ greater health awareness and willingness to participate in such research. Females also tend to experience eating issues more frequently. Additionally, recruitment settings may offer easier access to female participants.
Regarding the mean age of participants (16.4 ± 0.87), this result aligns with a study done by [19] on 48 adolescents, where the mean age of the participating adolescents was 16.5 years.
Regarding parental education and occupation, the highest proportion of fathers had a college degree or higher (35.3%). Furthermore, the highest proportion of mothers also had a college degree or higher (33.4%). Regarding occupational status, the highest percentages (50.3% and 67.7%) of fathers and mothers were employed and housewives, respectively. This finding aligns with the study by [6], conducted in Iraq, which showed that most mothers and fathers had diplomas and higher degrees (42.9% and 51.8%, respectively); 54.1% of mothers were housewives, and 63.8% of fathers were government employees.
The high percentage of mothers and fathers holding higher degrees suggests that the sample comes from families with good access to education. The fact that over half of the mothers are housewives may reflect cultural norms, while the high rate of fathers working in government jobs indicates economic stability. Together, these factors point to a relatively stable and educated family background, likely influenced by urban residency.
Regarding family income, the results found that 64.7% of the participants had a sufficient level of income, followed by 24.7% with barely sufficient income and 10.6% with insufficient income. This result is consistent with a study by [20] on adolescents, which found that the majority (70.8%) had normal family income.
The researcher’s opinion is that this may be due to the high percentage of fathers employed in government positions, which typically offer regular salaries and job security, as well as the relatively high educational levels of both parents, which are often associated with better income opportunities.
Related to residence area, most of the participants lived in urban areas (83.7%) compared to rural areas (16.3%). Our finding agrees with a study conducted by [21] on adolescents in Montenegro, which showed that about 69.9% of adolescents lived in urban areas.
However, a study by [22] conducted on 369 adolescents found that only 22.77% of adolescents came from urban areas, with a high percentage from rural areas. This finding is inconsistent with the current results.
The higher proportion of urban participants in our study may be attributed to better access to educational institutions, healthcare services, and communication infrastructure, which increases their likelihood of being included in school-based or online surveys. Additionally, urban schools may have more collaboration with researchers or be more easily reachable.
The present study measured the height, weight, and body mass index of all student participants. All age groups were compared with respect to age and sex using a growth chart. Table 2 shows that the majority of adolescents (52.2%) fell within the normal weight category, 17.9% were underweight, 20.9% were overweight, and 8.4% were categorized as obese. Our findings align with those of [23], conducted on 500 high school students in Babylon, where 14.2% of students were underweight, 55.4% were of normal weight, 20.4% were overweight, and 10% were obese.
Figure 1 indicates that 56.4% of adolescents followed a poor diet quality, while 43.8% of adolescents followed a good diet quality.
This result agrees with a study by [24], which found that 54 respondents (50%) had poor diet quality and 54 respondents (50%) had good diet quality. Another study conducted by [25], however, is not consistent with our findings. It observed that 37% of adolescents had poor diet quality, and 35.6% needed to improve their diet quality.
Poor diet quality among most adolescents is primarily due to a combination of limited nutritional knowledge, easy access to unhealthy food options, and social influences. Without proper education and support, teenagers often make food choices that lack balance and essential nutrients, negatively impacting their overall health.
Grains: In Table 3, the current results found that the highest percentage (37.2%) of adolescents consume bread two or more times daily, 26.1% consume rice once daily, and 34.2% consume pasta once weekly. This result agrees with a study by [26], which found that over 29.2% (352/1206) consumed refined grains and flour products more than four times per week, on average, in the month preceding data collection.
Most adolescents frequently consume rice, bread, and pasta because these foods are affordable, easily available, and provide quick energy. Cultural habits, family influence, and a lack of nutritional awareness also contribute to this pattern, often leading to unbalanced diets that lack variety and essential nutrients.
Fish, Chicken, and Meat: The highest proportions (53.0%, 26.6%, and 30.4%) of adolescents eat fish, chicken, and lamb meat once weekly, respectively.
Regarding chicken, a study by [27] found that around 90% of adolescents consume chicken daily. This finding is inconsistent with our result.
The limited weekly consumption of chicken among teenagers may reflect dietary monotony or lack of dietary diversity in many families. This could also be influenced by cooking habits, time constraints, or a preference for fast foods.
Related to fish and meat, the current result agrees with a study conducted by [28], which showed that 38.8% and 55% consumed fish and meat one to three times a week.
Infrequent consumption of fish and meat may be due to several factors, including high cost, limited household availability, or personal dislike of these foods.
Fruits and Vegetables: The largest proportion of adolescents eat most fruits and vegetables once weekly. These results align with a study carried out by [29], which demonstrated that almost half of adolescents consumed fruits and vegetables once to twice a week.
As researchers, we suggest this may be due to a lack of awareness about the health benefits of fruits and vegetables or a stronger preference for processed and sugary foods.
Fast Foods: Regarding fast foods, the results found that 40.2%, 35.6%, 32.9%, and 40.8% of participants eat pizza, burgers, falafel, and shawarma once weekly, respectively. A study conducted by [30] on Saudi adolescents showed that approximately one-third (28.5%) reported frequent fast-food consumption (more than twice a week), which agrees with the present findings.
Teenagers often eat fast food weekly due to its appealing taste and convenience. Social influences and peer pressure also make fast food a popular choice for group gatherings.
Dairy Products, Sweets & Snacks, and Beverages: In Table 3, the study found that the largest proportion of adolescents consumed most dairy products, sweets and snacks, and beverages once weekly.
Related to dairy products, a study by [31] found that nearly half of adolescents (48%) consumed dairy products at least once per day, which is inconsistent with our findings.
The low frequency of dairy product consumption among adolescents may be due to a combination of personal preferences, limited awareness, lifestyle factors, or a general dislike for the taste or texture of milk and dairy items.
Regarding sweets and snacks, most adolescents reported consuming them once a week.
A study conducted by [32] showed that almost forty percent of adolescents consume snacks daily, which disagrees with our results.
However, a study by [33] found that most adolescents consume sweets once a week or less, which is consistent with our current findings.
Adolescents may consume snacks and sweets only once a week due to parental control or family dietary rules that limit unhealthy food intake, economic constraints, or limited access to these foods during school days.
Table 4 reveals a significant relationship between several demographic characteristics—such as sex, the education and occupation of the mother, and family income—and diet quality.
Regarding sex, the results revealed that male adolescents are associated with better diet quality. This finding aligns with a study conducted in Saudi Arabia by [30] on 638 adolescents, which observed that the median diet quality score was higher among males compared to female adolescents. However, a study conducted by [34] on students showed that the diet quality score was significantly higher for girls than for boys (around 67.6 vs. 65.1, p \(<\) 0.001).
Male adolescents may often have better diet quality due to higher energy demands, greater involvement in physical activities, and possibly fewer social pressures regarding body image compared to females.
Regarding the mother’s education, the results show that higher education is associated with better dietary intake. A study by [35] demonstrated that maternal education level significantly influenced diet quality: primary school education decreased diet quality by -3.102 units, secondary school by -2.778 units, and high school by -1.526 units, while graduate education increased it by 1.541 units.
Adolescents with highly educated mothers are more likely to have better diet intake because educated mothers are often more aware of nutritional guidelines, food balance, and the importance of healthy eating habits. Additionally, adolescents whose mothers are employed may also experience better diet intake, as working mothers often have better access to resources, are more exposed to health-related information, and tend to plan meals more consciously to ensure their children’s well-being.
Regarding family income, the current study shows that sufficient family income is associated with good diet quality. This finding agrees with a study by [36], which showed that monthly household income reported a negative association with dietary quality, suggesting that adolescents from higher-income households had better dietary quality scores.
Higher monthly income is strongly associated with better diet quality because families with greater financial resources can afford a wider variety of healthy foods such as fruits, vegetables, lean meats, dairy products, and whole grains. They are also less likely to rely on cheap, high-calorie, nutrient-poor foods such as fried snacks or sugary drinks.
Table 5 reveals that there is also a significant relationship between body mass index (BMI) and diet quality. These findings indicate that adolescents with a normal weight are more likely to have better diet quality. This is supported by a study conducted in Iran by [37], which found that overweight and obesity were significantly associated with poor diet intake.
Poor diet intake can lead to both weight gain and weight loss in adolescents, depending on the nature of the imbalance. Excess intake of high-calorie, low-nutrient foods may result in weight gain, while restrictive or nutrient-deficient diets can cause weight loss and undernutrition.
The majority of adolescents were aged between 15–16, and most of them were female, equally distributed between fourth and fifth class. A substantial proportion of fathers and mothers held a college degree or higher, though a notable portion of mothers had only elementary education. More than half of the fathers were employed, while the majority of mothers were housewives. The largest proportion of adolescents fell within the normal weight category, and nearly thirty percent of adolescents are at risk of increased body weight. More than half of the adolescents (56.3%) had poor dietary intake.
Promoting a balanced dietary intake—neither excessive nor insufficient—can support healthy weight regulation. Collaborative efforts between parents, schools, and public health institutions are essential to foster environments that support good nutrition, ultimately improving adolescent well-being. Social media should be used to educate adolescents about healthy diets.